FAIRFAX, Va., July 25, 2022 /PRNewswire/ -- MainStreet Bancshares, Inc. (Nasdaq: MNSB & MNSBP), the holding company for MainStreet Bank, said its net interest margin widened as rates climbed in recent months, driving strong net income for the second quarter and six months ended June 30, 2022.
The Bank's loan portfolio is well positioned for increasing interest rates. "The FOMC's next announcement is due to be released on July 27 and based upon Street consensus we anticipate continued net interest margin expansion," said Jeff W. Dick, Chairman & CEO of MainStreet Bancshares, Inc. and MainStreet Bank.
"We have been anticipating this trend for some time and we strategically aligned our portfolio to flex as the economy shifts," Dick said. "Even as we focus on maintaining a rigorous credit culture, we are constantly looking to the future, sharpening our understanding of what clients demand in an evolving financial services market, and choosing to innovate."
A focal point of MainStreet Bank's innovation is its Avenu™ Software as a Service (SaaS) and Banking as a Service (BaaS) platform. Dick and other MainStreet Bank executives will discuss quarterly and half-year earnings and preview business developments at Avenu™ during its virtual webcast and quarterly earnings call at 2 p.m. Eastern time today.
Net income totaled $5.9 million for three months ended June 30, and $11.4 million for the six months ended June 30. Net interest income totaled $16.1 million in the second quarter, 6% higher than the immediately preceding quarter and 24.1% higher than the comparable period in 2021.
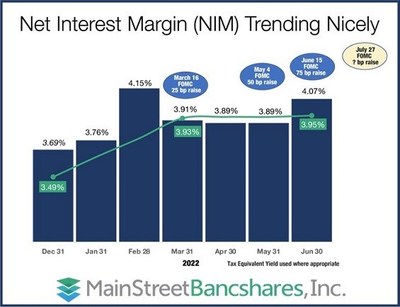
Rising interest rates propelled the net interest margin higher by 75 basis points to 3.95% for the quarter ended June 30, versus 3.20% a year earlier, on a tax equivalent basis. The Company's efficiency ratio remains solid at 55%. Total assets reached $1.8 billion in the second quarter, a 5.0% increase from a year earlier.
Quarterly results represent:
- 12.59% return on average equity
- 1.39% return on average assets
- $0.71 earnings per share of common stock (basic and diluted)
- $21.41 per common share book value
The level of Accumulated Other Comprehensive Income (AOCI) for the Company is low at -$6.56 million. The level is consistent with the size and quality of the investment portfolio, as the Bank enjoys consistent strong in-market loan demand.
The average loans outstanding rose just over 4% since the first quarter of 2022, as the bank was able to capitalize on continued demand in a higher interest rate environment. Asset quality remains pristine, as the Company had zero non-performing assets as of quarter ended June 30. Noninterest-bearing deposits represent 36% of the $1.5 billion in total deposits, and 70% of total deposits are core deposits.
"We operate in a robust market in Northern Virginia and the Washington Metropolitan area, and loan demand remains steady," said Abdul Hersiburane, president of MainStreet Bank. "The surge in loan volume that occurred for banks nationwide during the height of the COVID crisis has normalized, and what we are seeing now is solid, steady, organic loan growth that reflects the confidence of businesses in this marketplace that they have opportunities to grow." He noted that federal Paycheck Protection Program loans now represent a negligible 0.3% of the bank's loan portfolio.
Avenu
™
Avenu™, a division of MainStreet Bank, that provides Software as a Service (SaaS) and Banking as a Service (BaaS), continued to generate significant customer interest as additional fintechs joined the queue for our proprietary software solution. We are currently onboarding our initial beta customer with an anticipated go-live date in the fourth quarter of 2022.
"Fintechs have a strong need for knowledgeable, credible partners who can help them manage risk and compliance obligations," said Todd Youngren, President of Avenu™. "Preparing them to become fully compliant is a critical, intensive element of this process, and we are focusing our energy on getting that right. Following the beta stage, we anticipate that onboarding will be streamlined into a 60-day process."
Youngren noted that at the end of the first quarter, Avenu™ had 10 fintechs queued up at various stages of progress, including four that have indicated they intend to move forward as soon as the beta process is complete. These prospects include entities that serve the domestic needs of foreign nationals and entities that serve the education and nonprofit industries. Avenu has another 36 fintechs that have signed up to be "in the queue," and 128 fintechs that have signed up to receive updates and are actively monitoring our progress.
In addition to serving fintechs, the Avenu™ team has a robust array of existing customers that include payment processors and money service businesses. These relationships have been integral in identifying the needs and services that fintechs need banks to provide in order to have a successful partnership. These relationships provide the Bank with additional noninterest income and a strong source of low-cost deposits that can be integrated into the Bank's traditional source of income generation, net interest margin. As a benchmark, Youngren noted, Avenu™ is favorably impacting profitability, with its customers providing $70 million in noninterest bearing deposits and $488,000 in noninterest income in the six months ended June 30, 2022.
Refer to our press release on October 25, 2021, for additional information on the Company's proprietary Avenu™ solution. If you are a fintech looking to add payments and deposits to your solution, go to Avenu.bank and join the queue today.
ABOUT MAINSTREET BANK: MainStreet operates six branches in Herndon, Fairfax, McLean, Leesburg, Clarendon, and Washington D.C. MainStreet Bank has 55,000 free ATMs and a fully integrated online and mobile banking solution. The Bank is not restricted by a conventional branching system, as it can offer business customers the ability to Put Our Bank in Your Office®. With robust and easy-to-use online business banking technology, MainStreet has "put our bank" in thousands of businesses in the metropolitan area.
MainStreet Bank has a robust line of business and professional lending products, including government contracting lines of credit, commercial lines and term loans, residential and commercial construction, and commercial real estate. MainStreet also works with the SBA to offer 7A and 504 lending solutions. From sophisticated cash management to enhanced mobile banking and instant-issue Debit Cards, MainStreet Bank is always looking for ways to improve our customer's experience.
MainStreet Bank was the first community bank in the Washington, DC metropolitan area to offer a full online business banking solution. MainStreet Bank was also the first bank headquartered in the Commonwealth of Virginia to offer CDARS – a solution that provides multi-million-dollar FDIC insurance. Further information on the Bank can be obtained by visiting its website at mstreetbank.com.
This release contains forward-looking statements, including our expectations with respect to future events that are subject to various risks and uncertainties. The statements contained in this release that are not historical facts are forward-looking statements as defined in the Private Securities Litigation Reform Act of 1995. Words such as "may," "will," "could," "should," "expect," "plan," "project," "intend," "anticipate," "believe," "estimate," "predict," "potential," "pursuant," "target," "continue," and similar expressions are intended to identify such forward-looking statements. Factors that could cause actual results to differ materially from management's projections, forecasts, estimates and expectations include: fluctuation in market rates of interest and loan and deposit pricing, adverse changes in the overall national economy as well as adverse economic conditions in our specific market areas, future impacts of the novel coronavirus (COVID-19) outbreak, maintenance and development of well-established and valued client relationships and referral source relationships, and acquisition or loss of key production personnel. We caution readers that the list of factors above is not exclusive. The forward-looking statements are made as of the date of this release, and we may not undertake steps to update the forward-looking statements to reflect the impact of any circumstances or events that arise after the date the forward-looking statements are made. In addition, our past results of operations are not necessarily indicative of future performance.
|
Contact: Jeff W. Dick, Chairman & CEO
|
|
(703) 481-4567
|
|
UNAUDITED CONSOLIDATED BALANCE SHEET INFORMATION
|
|
(In thousands)
|
|
|
|
June 30,
2022
|
|
|
March 31,
2022
|
|
|
December 31,
2021
|
|
|
September 30,
2021
|
|
|
June 30,
2021
|
|
ASSETS
|
|
|
|
|
|
|
|
|
|
|
|
|
|
|
|
|
|
|
|
|
Cash and cash equivalents
|
|
|
|
|
|
|
|
|
|
|
|
|
|
|
|
|
|
|
|
|
Cash and due from banks
|
|
$
|
55,636
|
|
|
$
|
63,986
|
|
|
$
|
61,827
|
|
|
$
|
67,992
|
|
|
$
|
120,121
|
|
Federal funds sold
|
|
|
47,013
|
|
|
|
37,756
|
|
|
|
31,372
|
|
|
|
65,725
|
|
|
|
56,164
|
|
Total cash and cash equivalents
|
|
|
102,649
|
|
|
|
101,742
|
|
|
|
93,199
|
|
|
|
133,717
|
|
|
|
176,285
|
|
Investment securities available for sale, at fair value
|
|
|
143,240
|
|
|
|
123,802
|
|
|
|
99,913
|
|
|
|
171,603
|
|
|
|
165,791
|
|
Investment securities held to maturity, at carrying value
|
|
|
17,698
|
|
|
|
18,769
|
|
|
|
20,349
|
|
|
|
21,148
|
|
|
|
21,181
|
|
Restricted equity securities, at cost
|
|
|
16,485
|
|
|
|
17,209
|
|
|
|
15,609
|
|
|
|
9,972
|
|
|
|
9,994
|
|
Loans, net of allowance for loan losses of $12,982,
$12,500, $11,697,$11,428, and $11,133, respectively
|
|
|
1,416,875
|
|
|
|
1,413,238
|
|
|
|
1,341,760
|
|
|
|
1,246,331
|
|
|
|
1,256,436
|
|
Premises and equipment, net
|
|
|
14,756
|
|
|
|
14,833
|
|
|
|
14,863
|
|
|
|
14,795
|
|
|
|
13,929
|
|
Other real estate owned, net
|
|
|
—
|
|
|
|
—
|
|
|
|
775
|
|
|
|
1,158
|
|
|
|
1,158
|
|
Accrued interest and other receivables
|
|
|
7,313
|
|
|
|
6,980
|
|
|
|
7,701
|
|
|
|
4,718
|
|
|
|
8,752
|
|
Computer software, net of amortization
|
|
|
4,956
|
|
|
|
3,906
|
|
|
|
2,493
|
|
|
|
1,165
|
|
|
|
—
|
|
Bank owned life insurance
|
|
|
36,742
|
|
|
|
36,492
|
|
|
|
36,241
|
|
|
|
35,987
|
|
|
|
35,736
|
|
Other assets
|
|
|
32,665
|
|
|
|
24,777
|
|
|
|
14,499
|
|
|
|
16,605
|
|
|
|
18,433
|
|
Total Assets
|
|
$
|
1,793,379
|
|
|
$
|
1,761,748
|
|
|
$
|
1,647,402
|
|
|
$
|
1,657,199
|
|
|
$
|
1,707,695
|
|
LIABILITIES AND STOCKHOLDERS' EQUITY
|
|
|
|
|
|
|
|
|
|
|
|
|
|
|
|
|
|
|
|
|
Liabilities:
|
|
|
|
|
|
|
|
|
|
|
|
|
|
|
|
|
|
|
|
|
Non-interest bearing deposits
|
|
$
|
535,591
|
|
|
$
|
514,160
|
|
|
$
|
530,678
|
|
|
$
|
475,157
|
|
|
$
|
486,001
|
|
Interest bearing DDA deposits
|
|
|
99,223
|
|
|
|
76,286
|
|
|
|
69,232
|
|
|
|
63,622
|
|
|
|
68,028
|
|
Savings and NOW deposits
|
|
|
58,156
|
|
|
|
81,817
|
|
|
|
85,175
|
|
|
|
79,556
|
|
|
|
72,353
|
|
Money market deposits
|
|
|
231,207
|
|
|
|
301,842
|
|
|
|
267,730
|
|
|
|
310,776
|
|
|
|
310,303
|
|
Time deposits
|
|
|
575,950
|
|
|
|
460,839
|
|
|
|
459,148
|
|
|
|
485,255
|
|
|
|
528,247
|
|
Total deposits
|
|
|
1,500,127
|
|
|
|
1,434,944
|
|
|
|
1,411,963
|
|
|
|
1,414,366
|
|
|
|
1,464,932
|
|
Federal Home Loan Bank advances and other borrowings
|
|
|
—
|
|
|
|
40,000
|
|
|
|
—
|
|
|
|
—
|
|
|
|
—
|
|
Subordinated debt
|
|
|
72,047
|
|
|
|
71,955
|
|
|
|
29,294
|
|
|
|
40,635
|
|
|
|
40,576
|
|
Other liabilities
|
|
|
32,801
|
|
|
|
26,053
|
|
|
|
17,357
|
|
|
|
18,169
|
|
|
|
22,559
|
|
Total Liabilities
|
|
|
1,604,975
|
|
|
|
1,572,952
|
|
|
|
1,458,614
|
|
|
|
1,473,170
|
|
|
|
1,528,067
|
|
Stockholders' Equity:
|
|
|
|
|
|
|
|
|
|
|
|
|
|
|
|
|
|
|
|
|
Preferred stock
|
|
|
27,263
|
|
|
|
27,263
|
|
|
|
27,263
|
|
|
|
27,263
|
|
|
|
27,263
|
|
Common stock
|
|
|
29,178
|
|
|
|
29,642
|
|
|
|
29,466
|
|
|
|
29,462
|
|
|
|
29,446
|
|
Capital surplus
|
|
|
64,822
|
|
|
|
66,798
|
|
|
|
67,668
|
|
|
|
67,152
|
|
|
|
66,667
|
|
Retained earnings
|
|
|
73,702
|
|
|
|
68,691
|
|
|
|
64,194
|
|
|
|
59,920
|
|
|
|
55,676
|
|
Accumulated other comprehensive income (loss)
|
|
|
(6,561)
|
|
|
|
(3,598)
|
|
|
|
197
|
|
|
|
232
|
|
|
|
576
|
|
Total Stockholders' Equity
|
|
|
188,404
|
|
|
|
188,796
|
|
|
|
188,788
|
|
|
|
184,029
|
|
|
|
179,628
|
|
Total Liabilities and Stockholders' Equity
|
|
$
|
1,793,379
|
|
|
$
|
1,761,748
|
|
|
$
|
1,647,402
|
|
|
$
|
1,657,199
|
|
|
$
|
1,707,695
|
|
UNAUDITED CONSOLIDATED STATEMENTS OF INCOME INFORMATION
|
|
(In thousands, except share and per share data)
|
|
|
|
Year-to-Date
|
|
|
|
Three Months Ended
|
|
|
June 30,
2022
|
|
|
June 30,
2021
|
|
|
June 30,
2022
|
|
|
March 31,
2022
|
|
|
December
31, 2021
|
|
|
September
30, 2021
|
|
|
June 30,
2021
|
|
INTEREST INCOME:
|
|
|
|
|
|
|
|
|
|
|
|
|
|
|
|
|
|
|
|
|
|
|
|
|
|
|
|
|
|
Interest and fees on loans
|
|
$
|
34,639
|
|
|
$
|
31,049
|
|
|
|
$
|
17,954
|
|
|
$
|
16,685
|
|
|
$
|
15,532
|
|
|
$
|
15,162
|
|
|
$
|
15,257
|
|
Interest on investment securities
|
|
|
|
|
|
|
|
|
|
|
|
|
|
|
|
|
|
|
|
|
|
|
|
|
|
|
|
|
|
Taxable securities
|
|
|
758
|
|
|
|
592
|
|
|
|
|
401
|
|
|
|
357
|
|
|
|
327
|
|
|
|
318
|
|
|
|
332
|
|
Tax-exempt securities
|
|
|
535
|
|
|
|
535
|
|
|
|
|
263
|
|
|
|
272
|
|
|
|
283
|
|
|
|
267
|
|
|
|
265
|
|
Interest on federal funds sold
|
|
|
229
|
|
|
|
35
|
|
|
|
|
195
|
|
|
|
34
|
|
|
|
61
|
|
|
|
38
|
|
|
|
20
|
|
Total interest income
|
|
|
36,161
|
|
|
|
32,211
|
|
|
|
|
18,813
|
|
|
|
17,348
|
|
|
|
16,203
|
|
|
|
15,785
|
|
|
|
15,874
|
|
INTEREST EXPENSE:
|
|
|
|
|
|
|
|
|
|
|
|
|
|
|
|
|
|
|
|
|
|
|
|
|
|
|
|
|
|
Interest on interest bearing DDA deposits
|
|
|
170
|
|
|
|
110
|
|
|
|
|
105
|
|
|
|
65
|
|
|
|
59
|
|
|
|
60
|
|
|
|
55
|
|
Interest on savings and NOW deposits
|
|
|
79
|
|
|
|
89
|
|
|
|
|
42
|
|
|
|
37
|
|
|
|
38
|
|
|
|
38
|
|
|
|
47
|
|
Interest on money market deposits
|
|
|
270
|
|
|
|
497
|
|
|
|
|
151
|
|
|
|
119
|
|
|
|
127
|
|
|
|
148
|
|
|
|
220
|
|
Interest on time deposits
|
|
|
2,961
|
|
|
|
4,244
|
|
|
|
|
1,530
|
|
|
|
1,431
|
|
|
|
1,574
|
|
|
|
1,795
|
|
|
|
1,994
|
|
Interest on Federal Home Loan Bank
advances and other borrowings
|
|
|
83
|
|
|
|
—
|
|
|
|
|
52
|
|
|
|
31
|
|
|
|
—
|
|
|
|
—
|
|
|
|
—
|
|
Interest on subordinated debt
|
|
|
1,280
|
|
|
|
805
|
|
|
|
|
812
|
|
|
|
468
|
|
|
|
539
|
|
|
|
541
|
|
|
|
567
|
|
Total interest expense
|
|
|
4,843
|
|
|
|
5,745
|
|
|
|
|
2,692
|
|
|
|
2,151
|
|
|
|
2,337
|
|
|
|
2,582
|
|
|
|
2,883
|
|
Net interest income
|
|
|
31,318
|
|
|
|
26,466
|
|
|
|
|
16,121
|
|
|
|
15,197
|
|
|
|
13,866
|
|
|
|
13,203
|
|
|
|
12,991
|
|
Provision for (recovery of) loan losses
|
|
|
1,280
|
|
|
|
(1,760)
|
|
|
|
|
480
|
|
|
|
800
|
|
|
|
295
|
|
|
|
290
|
|
|
|
(2,080)
|
|
Net interest income after provision
for (recovery of) loan losses
|
|
|
30,038
|
|
|
|
28,226
|
|
|
|
|
15,641
|
|
|
|
14,397
|
|
|
|
13,571
|
|
|
|
12,913
|
|
|
|
15,071
|
|
NON-INTEREST INCOME:
|
|
|
|
|
|
|
|
|
|
|
|
|
|
|
|
|
|
|
|
|
|
|
|
|
|
|
|
|
|
Deposit account service charges
|
|
|
1,209
|
|
|
|
1,160
|
|
|
|
|
597
|
|
|
|
611
|
|
|
|
624
|
|
|
|
642
|
|
|
|
621
|
|
Bank owned life insurance income
|
|
|
500
|
|
|
|
395
|
|
|
|
|
250
|
|
|
|
251
|
|
|
|
253
|
|
|
|
252
|
|
|
|
218
|
|
Loan swap fee income
|
|
|
100
|
|
|
|
—
|
|
|
|
|
101
|
|
|
|
—
|
|
|
|
83
|
|
|
|
—
|
|
|
|
—
|
|
Net gain on held-to-maturity securities
|
|
|
4
|
|
|
|
3
|
|
|
|
|
4
|
|
|
|
—
|
|
|
|
3
|
|
|
|
—
|
|
|
|
—
|
|
Net gain (loss) on sale of loans
|
|
|
43
|
|
|
|
474
|
|
|
|
|
—
|
|
|
|
43
|
|
|
|
413
|
|
|
|
(40)
|
|
|
|
130
|
|
Other fee income
|
|
|
569
|
|
|
|
969
|
|
|
|
|
312
|
|
|
|
257
|
|
|
|
247
|
|
|
|
632
|
|
|
|
586
|
|
Total other income
|
|
|
2,425
|
|
|
|
3,001
|
|
|
|
|
1,264
|
|
|
|
1,162
|
|
|
|
1,623
|
|
|
|
1,486
|
|
|
|
1,555
|
|
NON-INTEREST EXPENSES:
|
|
|
|
|
|
|
|
|
|
|
|
|
|
|
|
|
|
|
|
|
|
|
|
|
|
|
|
|
|
Salaries and employee benefits
|
|
|
11,152
|
|
|
|
9,430
|
|
|
|
|
5,604
|
|
|
|
5,548
|
|
|
|
5,029
|
|
|
|
4,847
|
|
|
|
4,663
|
|
Furniture and equipment expenses
|
|
|
1,316
|
|
|
|
1,026
|
|
|
|
|
659
|
|
|
|
657
|
|
|
|
726
|
|
|
|
716
|
|
|
|
500
|
|
Advertising and marketing
|
|
|
980
|
|
|
|
677
|
|
|
|
|
574
|
|
|
|
406
|
|
|
|
450
|
|
|
|
438
|
|
|
|
402
|
|
Occupancy expenses
|
|
|
693
|
|
|
|
693
|
|
|
|
|
352
|
|
|
|
341
|
|
|
|
449
|
|
|
|
399
|
|
|
|
387
|
|
Outside services
|
|
|
935
|
|
|
|
616
|
|
|
|
|
567
|
|
|
|
368
|
|
|
|
485
|
|
|
|
292
|
|
|
|
280
|
|
Administrative expenses
|
|
|
405
|
|
|
|
291
|
|
|
|
|
195
|
|
|
|
210
|
|
|
|
192
|
|
|
|
202
|
|
|
|
141
|
|
Other operating expenses
|
|
|
2,976
|
|
|
|
2,950
|
|
|
|
|
1,543
|
|
|
|
1,433
|
|
|
|
1,389
|
|
|
|
1,567
|
|
|
|
1,500
|
|
Total other expenses
|
|
|
18,457
|
|
|
|
15,683
|
|
|
|
|
9,494
|
|
|
|
8,963
|
|
|
|
8,720
|
|
|
|
8,461
|
|
|
|
7,873
|
|
Income before income tax expense
|
|
|
14,006
|
|
|
|
15,544
|
|
|
|
|
7,411
|
|
|
|
6,596
|
|
|
|
6,474
|
|
|
|
5,938
|
|
|
|
8,753
|
|
Income tax expense
|
|
|
2,654
|
|
|
|
2,969
|
|
|
|
|
1,481
|
|
|
|
1,173
|
|
|
|
1,660
|
|
|
|
1,155
|
|
|
|
1,627
|
|
Net Income
|
|
|
11,352
|
|
|
|
12,575
|
|
|
|
|
5,930
|
|
|
|
5,423
|
|
|
|
4,814
|
|
|
|
4,783
|
|
|
|
7,126
|
|
Preferred stock dividends
|
|
|
1,078
|
|
|
|
1,078
|
|
|
|
|
539
|
|
|
|
539
|
|
|
|
539
|
|
|
|
539
|
|
|
|
539
|
|
Net income available to common
shareholders
|
|
$
|
10,274
|
|
|
$
|
11,497
|
|
|
|
$
|
5,391
|
|
|
$
|
4,884
|
|
|
$
|
4,275
|
|
|
$
|
4,244
|
|
|
$
|
6,587
|
|
Net income per common share, basic and
diluted
|
|
$
|
1.35
|
|
|
$
|
1.53
|
|
|
|
$
|
0.71
|
|
|
$
|
0.64
|
|
|
$
|
0.56
|
|
|
$
|
0.56
|
|
|
$
|
0.87
|
|
Weighted average number of common
shares, basic and diluted
|
|
|
7,611,303
|
|
|
|
7,535,061
|
|
|
|
|
7,575,484
|
|
|
|
7,647,519
|
|
|
|
7,595,062
|
|
|
|
7,571,214
|
|
|
|
7,546,452
|
|
UNAUDITED LOAN, DEPOSIT AND BORROWING DETAIL
|
|
(In thousands)
|
|
|
|
June 30, 2022
|
|
|
March 31, 2022
|
|
|
June 30, 2021
|
|
|
Percentage
Change
|
|
|
|
$ Amount
|
|
|
% of
Total
|
|
|
$ Amount
|
|
|
% of
Total
|
|
|
$ Amount
|
|
|
% of
Total
|
|
|
Last 3
Mos
|
|
|
Last
12 Mos
|
|
|
LOANS:
|
|
|
|
|
|
|
|
|
|
|
|
|
|
|
|
|
|
|
|
|
|
|
|
|
|
|
|
|
|
|
|
|
|
Construction and land
development loans
|
|
$
|
358,062
|
|
|
|
25.0
|
%
|
|
$
|
344,605
|
|
|
|
24.1
|
%
|
|
$
|
328,480
|
|
|
|
25.8
|
%
|
|
|
3.9
|
%
|
|
|
9.0
|
%
|
|
Residential real estate loans
|
|
|
366,758
|
|
|
|
25.6
|
%
|
|
|
367,138
|
|
|
|
25.7
|
%
|
|
|
190,426
|
|
|
|
14.9
|
%
|
|
|
-0.1
|
%
|
|
|
92.6
|
%
|
|
Commercial real estate loans
|
|
|
599,683
|
|
|
|
41.8
|
%
|
|
|
588,004
|
|
|
|
41.1
|
%
|
|
|
503,514
|
|
|
|
39.5
|
%
|
|
|
2.0
|
%
|
|
|
19.1
|
%
|
|
Commercial industrial loans -
Other
|
|
|
88,628
|
|
|
|
6.2
|
%
|
|
|
92,408
|
|
|
|
6.5
|
%
|
|
|
93,837
|
|
|
|
7.4
|
%
|
|
|
-4.1
|
%
|
|
|
-5.6
|
%
|
|
Commercial industrial loans - PPP
Loans
|
|
|
4,044
|
|
|
|
0.3
|
%
|
|
|
18,776
|
|
|
|
1.3
|
%
|
|
|
124,578
|
|
|
|
9.8
|
%
|
|
|
-78.5
|
%
|
|
|
-96.8
|
%
|
|
Consumer loans
|
|
|
17,223
|
|
|
|
1.1
|
%
|
|
|
19,711
|
|
|
|
1.3
|
%
|
|
|
33,643
|
|
|
|
2.6
|
%
|
|
|
-12.6
|
%
|
|
|
-48.8
|
%
|
|
Total Gross Loans
|
|
$
|
1,434,398
|
|
|
|
100.0
|
%
|
|
$
|
1,430,642
|
|
|
|
100.0
|
%
|
|
$
|
1,274,478
|
|
|
|
100.0
|
%
|
|
|
0.3
|
%
|
|
|
12.5
|
%
|
|
Less: Allowance for loan losses
|
|
|
(12,982)
|
|
|
|
|
|
|
|
(12,500)
|
|
|
|
|
|
|
|
(11,133)
|
|
|
|
|
|
|
|
|
|
|
|
|
|
|
Net deferred loan
fees
|
|
|
(4,541)
|
|
|
|
|
|
|
|
(4,904)
|
|
|
|
|
|
|
|
(6,909)
|
|
|
|
|
|
|
|
|
|
|
|
|
|
|
Net Loans
|
|
$
|
1,416,875
|
|
|
|
|
|
|
$
|
1,413,238
|
|
|
|
|
|
|
$
|
1,256,436
|
|
|
|
|
|
|
|
|
|
|
|
|
|
|
DEPOSITS:
|
|
|
|
|
|
|
|
|
|
|
|
|
|
|
|
|
|
|
|
|
|
|
|
|
|
|
|
|
|
|
|
|
|
Non-interest bearing demand
deposits
|
|
$
|
535,591
|
|
|
|
35.7
|
%
|
|
$
|
514,160
|
|
|
|
35.8
|
%
|
|
$
|
486,001
|
|
|
|
33.2
|
%
|
|
|
4.2
|
%
|
|
|
10.2
|
%
|
|
Interest-bearing demand
deposits:
|
|
|
|
|
|
|
|
|
|
|
|
|
|
|
|
|
|
|
|
|
|
|
|
|
|
|
|
|
|
|
|
|
|
Demand deposits
|
|
|
99,223
|
|
|
|
6.6
|
%
|
|
|
76,286
|
|
|
|
5.3
|
%
|
|
|
68,028
|
|
|
|
4.6
|
%
|
|
|
30.1
|
%
|
|
|
45.9
|
%
|
|
Savings and NOW deposits
|
|
|
58,156
|
|
|
|
3.9
|
%
|
|
|
81,817
|
|
|
|
5.7
|
%
|
|
|
72,353
|
|
|
|
4.9
|
%
|
|
|
-28.9
|
%
|
|
|
-19.6
|
%
|
|
Money market accounts
|
|
|
231,207
|
|
|
|
15.4
|
%
|
|
|
301,842
|
|
|
|
21.0
|
%
|
|
|
310,303
|
|
|
|
21.2
|
%
|
|
|
-23.4
|
%
|
|
|
-25.5
|
%
|
|
Certificates of deposit
$250,000 or more
|
|
|
383,340
|
|
|
|
25.6
|
%
|
|
|
292,978
|
|
|
|
20.4
|
%
|
|
|
303,769
|
|
|
|
20.7
|
%
|
|
|
30.8
|
%
|
|
|
26.2
|
%
|
|
Certificates of deposit less
than $250,000
|
|
|
192,610
|
|
|
|
12.8
|
%
|
|
|
167,861
|
|
|
|
11.8
|
%
|
|
|
224,478
|
|
|
|
15.4
|
%
|
|
|
14.7
|
%
|
|
|
-14.2
|
%
|
|
Total Deposits
|
|
$
|
1,500,127
|
|
|
|
100.0
|
%
|
|
$
|
1,434,944
|
|
|
|
100.0
|
%
|
|
$
|
1,464,932
|
|
|
|
100.0
|
%
|
|
|
4.5
|
%
|
|
|
2.4
|
%
|
|
BORROWINGS:
|
|
|
|
|
|
|
|
|
|
|
|
|
|
|
|
|
|
|
|
|
|
|
|
|
|
|
|
|
|
|
|
|
|
Federal Home Loan Bank
advances
|
|
|
—
|
|
|
|
0.0
|
%
|
|
|
40,000
|
|
|
|
35.7
|
%
|
|
|
—
|
|
|
|
—
|
|
|
|
100.0
|
%
|
|
|
0.0
|
%
|
|
Subordinated debt
|
|
|
72,047
|
|
|
|
100.0
|
%
|
|
|
71,955
|
|
|
|
64.3
|
%
|
|
|
40,576
|
|
|
|
100.0
|
%
|
|
|
0.1
|
%
|
|
|
77.6
|
%
|
|
Total Borrowings
|
|
$
|
72,047
|
|
|
|
100.0
|
%
|
|
$
|
111,955
|
|
|
|
100.0
|
%
|
|
$
|
40,576
|
|
|
|
100.0
|
%
|
|
|
-35.6
|
%
|
|
|
77.6
|
%
|
|
Total Deposits and Borrowings
|
|
$
|
1,572,174
|
|
|
|
|
|
|
$
|
1,546,899
|
|
|
|
|
|
|
$
|
1,505,508
|
|
|
|
|
|
|
|
1.6
|
%
|
|
|
4.4
|
%
|
|
|
|
|
|
|
|
|
|
|
|
|
|
|
|
|
|
|
|
|
|
|
|
|
|
|
|
|
|
|
|
|
|
|
Core customer funding sources
(1)
|
|
$
|
1,094,493
|
|
|
|
69.6
|
%
|
|
$
|
1,135,503
|
|
|
|
73.4
|
%
|
|
$
|
1,118,795
|
|
|
|
74.3
|
%
|
|
|
-3.6
|
%
|
|
|
-2.2
|
%
|
|
Brokered and listing service
sources
(2)
|
|
|
405,634
|
|
|
|
25.8
|
%
|
|
|
299,441
|
|
|
|
19.4
|
%
|
|
|
346,137
|
|
|
|
23.0
|
%
|
|
|
35.5
|
%
|
|
|
17.2
|
%
|
|
Federal Home Loan Bank
advances
|
|
|
—
|
|
|
|
0.0
|
%
|
|
|
40,000
|
|
|
|
2.6
|
%
|
|
|
—
|
|
|
|
—
|
|
|
|
100.0
|
%
|
|
|
0.0
|
%
|
|
Subordinated debt
(3)
|
|
|
72,047
|
|
|
|
4.6
|
%
|
|
|
71,955
|
|
|
|
4.6
|
%
|
|
|
40,576
|
|
|
|
2.7
|
%
|
|
|
0.1
|
%
|
|
|
77.6
|
%
|
|
Total Funding Sources
|
|
$
|
1,572,174
|
|
|
|
100.0
|
%
|
|
$
|
1,546,899
|
|
|
|
100.0
|
%
|
|
$
|
1,505,508
|
|
|
|
100.0
|
%
|
|
|
1.6
|
%
|
|
|
4.4
|
%
|
|
|
(1)
|
Includes ICS, CDARS, and reciprocal deposits maintained by customers, which represent sweep accounts tied to customer operating accounts
|
|
(2)
|
Consists of certificates of deposit (CD) through multiple listing services and multiple brokered deposit services, as well as ICS and CDARS one-way certificates of deposit and regional money market accounts
|
|
(3)
|
Subordinated debt obligation qualifies as Tier 2 capital at the holding company and Tier 1 capital at the Bank
|
|
UNAUDITED AVERAGE BALANCE SHEETS, INTEREST AND RATES
|
|
(In thousands)
|
|
|
|
For the three months ended June 30,
2022
|
|
|
For the three months ended June 30,
2021
|
|
|
|
Average
Balance
|
|
|
Interest
Income/
Expense
(4)(5)
|
|
|
Average
Yields/ Rate
(annualized)
(4)(5)
|
|
|
Average
Balance
|
|
|
Interest
Income/
Expense
(4)(5)
|
|
|
Average
Yields/Rate
(annualized)
(4)(5)
|
|
|
ASSETS:
|
|
|
|
|
|
|
|
|
|
|
|
|
|
|
|
|
|
|
|
|
|
|
|
|
|
Interest earning assets:
|
|
|
|
|
|
|
|
|
|
|
|
|
|
|
|
|
|
|
|
|
|
|
|
|
|
Loans
(1)(2)(3)
|
|
$
|
1,434,877
|
|
|
$
|
17,954
|
|
|
|
5.02
|
%
|
|
$
|
1,302,722
|
|
|
$
|
15,257
|
|
|
|
4.70
|
%
|
|
Securities:
|
|
|
|
|
|
|
|
|
|
|
|
|
|
|
|
|
|
|
|
|
|
|
|
|
|
Taxable
|
|
|
73,153
|
|
|
|
401
|
|
|
|
2.20
|
%
|
|
|
54,810
|
|
|
|
332
|
|
|
|
2.43
|
%
|
|
Tax-exempt
|
|
|
38,507
|
|
|
|
333
|
|
|
|
3.47
|
%
|
|
|
36,010
|
|
|
|
335
|
|
|
|
3.74
|
%
|
|
Federal funds and interest-
bearing deposits
|
|
|
98,326
|
|
|
|
195
|
|
|
|
0.80
|
%
|
|
|
245,257
|
|
|
|
20
|
|
|
|
0.03
|
%
|
|
Total interest earning
assets
|
|
$
|
1,644,863
|
|
|
$
|
18,883
|
|
|
|
4.60
|
%
|
|
$
|
1,638,799
|
|
|
$
|
15,944
|
|
|
|
3.90
|
%
|
|
Other assets
|
|
|
65,225
|
|
|
|
|
|
|
|
|
|
|
|
69,950
|
|
|
|
|
|
|
|
|
|
|
Total assets
|
|
$
|
1,710,088
|
|
|
|
|
|
|
|
|
|
|
$
|
1,708,749
|
|
|
|
|
|
|
|
|
|
|
Liabilities and Stockholders'
Equity:
|
|
|
|
|
|
|
|
|
|
|
|
|
|
|
|
|
|
|
|
|
|
|
|
|
|
Interest-bearing liabilities:
|
|
|
|
|
|
|
|
|
|
|
|
|
|
|
|
|
|
|
|
|
|
|
|
|
|
Interest-bearing demand
deposits
|
|
$
|
96,352
|
|
|
$
|
105
|
|
|
|
0.44
|
%
|
|
$
|
68,714
|
|
|
$
|
55
|
|
|
|
0.32
|
%
|
|
Savings and NOW deposits
|
|
|
62,588
|
|
|
|
42
|
|
|
|
0.27
|
%
|
|
|
71,747
|
|
|
|
47
|
|
|
|
0.26
|
%
|
|
Money market deposit
accounts
|
|
|
234,097
|
|
|
|
151
|
|
|
|
0.26
|
%
|
|
|
322,332
|
|
|
|
220
|
|
|
|
0.27
|
%
|
|
Time deposits
|
|
|
499,734
|
|
|
|
1,530
|
|
|
|
1.23
|
%
|
|
|
538,766
|
|
|
|
1,994
|
|
|
|
1.48
|
%
|
|
Total interest-bearing deposits
|
|
$
|
892,771
|
|
|
$
|
1,828
|
|
|
|
0.82
|
%
|
|
$
|
1,001,559
|
|
|
$
|
2,316
|
|
|
|
0.93
|
%
|
|
Federal funds purchased
|
|
|
1
|
|
|
|
—
|
|
|
|
—
|
|
|
|
1
|
|
|
|
—
|
|
|
|
—
|
|
|
Subordinated debt
|
|
|
72,009
|
|
|
|
812
|
|
|
|
4.52
|
%
|
|
|
39,716
|
|
|
|
567
|
|
|
|
5.73
|
%
|
|
FHLB borrowings
|
|
|
35,275
|
|
|
|
52
|
|
|
|
0.59
|
%
|
|
|
—
|
|
|
|
—
|
|
|
|
—
|
|
|
Total interest-bearing liabilities
|
|
$
|
1,000,056
|
|
|
$
|
2,692
|
|
|
|
1.08
|
%
|
|
$
|
1,041,276
|
|
|
$
|
2,883
|
|
|
|
1.11
|
%
|
|
Demand deposits and other
liabilities
|
|
|
521,130
|
|
|
|
|
|
|
|
|
|
|
|
491,857
|
|
|
|
|
|
|
|
|
|
|
Total liabilities
|
|
$
|
1,521,186
|
|
|
|
|
|
|
|
|
|
|
$
|
1,533,133
|
|
|
|
|
|
|
|
|
|
|
Stockholders' Equity
|
|
|
188,902
|
|
|
|
|
|
|
|
|
|
|
|
175,616
|
|
|
|
|
|
|
|
|
|
|
Total Liabilities and Stockholders'
Equity
|
|
$
|
1,710,088
|
|
|
|
|
|
|
|
|
|
|
$
|
1,708,749
|
|
|
|
|
|
|
|
|
|
|
Interest Rate Spread
|
|
|
|
|
|
|
|
|
|
|
3.52
|
%
|
|
|
|
|
|
|
|
|
|
|
2.84
|
%
|
|
Net Interest Income
|
|
|
|
|
|
$
|
16,191
|
|
|
|
|
|
|
|
|
|
|
$
|
13,061
|
|
|
|
|
|
|
Net Interest Margin
|
|
|
|
|
|
|
|
|
|
|
3.95
|
%
|
|
|
|
|
|
|
|
|
|
|
3.20
|
%
|
|
(1)
|
Includes loans classified as non-accrual
|
|
(2)
|
Includes average PPP balances of $11.4 million, related interest income of approximately $28,000, and $392,000 in PPP fees recognized for the three months ended June 30, 2022. Includes average PPP balances of $161.8 million, related interest income of approximately $404,000, and $1.2 million in PPP fees recognized for the three months ended June 30, 2021
|
|
(3)
|
Total loan interest income includes amortization of deferred loan fees, net of deferred loan costs
|
|
(4)
|
Income and yields for all periods presented are reported on a tax-equivalent basis using the federal statutory rate of 21%
|
|
(5)
|
Refer to Appendix for reconciliation of non-GAAP measures
|
|
UNAUDITED AVERAGE BALANCE SHEETS, INTEREST AND RATES
|
|
(In thousands)
|
|
|
|
For the six months ended June 30, 2022
|
|
|
For the six months ended June 30, 2021
|
|
|
|
Average
Balance
|
|
|
Interest
Income/
Expense
(4)(5)
|
|
|
Average
Yields/ Rate
(annualized)
(4)(5)
|
|
|
Average
Balance
|
|
|
Interest
Income/
Expense
(4)(5)
|
|
|
Average
Yields/ Rate
(annualized)
(4)(5)
|
|
|
ASSETS:
|
|
|
|
|
|
|
|
|
|
|
|
|
|
|
|
|
|
|
|
|
|
|
|
|
|
Interest earning assets:
|
|
|
|
|
|
|
|
|
|
|
|
|
|
|
|
|
|
|
|
|
|
|
|
|
|
Loans
(1)(2)(3)
|
|
$
|
1,406,457
|
|
|
$
|
34,639
|
|
|
|
4.97
|
%
|
|
$
|
1,311,085
|
|
|
$
|
31,049
|
|
|
|
4.78
|
%
|
|
Securities:
|
|
|
|
|
|
|
|
|
|
|
|
|
|
|
|
|
|
|
|
|
|
|
|
|
|
Taxable
|
|
|
73,283
|
|
|
|
758
|
|
|
|
2.09
|
%
|
|
|
54,100
|
|
|
|
592
|
|
|
|
2.21
|
%
|
|
Tax-exempt
|
|
|
39,023
|
|
|
|
677
|
|
|
|
3.50
|
%
|
|
|
36,247
|
|
|
|
677
|
|
|
|
3.77
|
%
|
|
Federal funds and interest-
bearing deposits
|
|
|
91,081
|
|
|
|
229
|
|
|
|
0.51
|
%
|
|
|
219,648
|
|
|
|
35
|
|
|
|
0.03
|
%
|
|
Total interest earning
assets
|
|
$
|
1,609,844
|
|
|
$
|
36,303
|
|
|
|
4.55
|
%
|
|
$
|
1,621,080
|
|
|
$
|
32,353
|
|
|
|
4.02
|
%
|
|
Other assets
|
|
|
76,387
|
|
|
|
|
|
|
|
|
|
|
|
70,337
|
|
|
|
|
|
|
|
|
|
|
Total assets
|
|
$
|
1,686,231
|
|
|
|
|
|
|
|
|
|
|
$
|
1,691,417
|
|
|
|
|
|
|
|
|
|
|
Liabilities and Stockholders'
Equity:
|
|
|
|
|
|
|
|
|
|
|
|
|
|
|
|
|
|
|
|
|
|
|
|
|
|
Interest-bearing liabilities:
|
|
|
|
|
|
|
|
|
|
|
|
|
|
|
|
|
|
|
|
|
|
|
|
|
|
Interest-bearing demand
deposits
|
|
$
|
83,450
|
|
|
$
|
170
|
|
|
|
0.41
|
%
|
|
$
|
68,556
|
|
|
$
|
110
|
|
|
|
0.32
|
%
|
|
Savings and NOW deposits
|
|
|
72,617
|
|
|
|
79
|
|
|
|
0.22
|
%
|
|
|
70,875
|
|
|
|
89
|
|
|
|
0.25
|
%
|
|
Money market deposit
accounts
|
|
|
250,908
|
|
|
|
270
|
|
|
|
0.22
|
%
|
|
|
367,424
|
|
|
|
497
|
|
|
|
0.27
|
%
|
|
Time deposits
|
|
|
478,376
|
|
|
|
2,961
|
|
|
|
1.25
|
%
|
|
|
509,465
|
|
|
|
4,244
|
|
|
|
1.68
|
%
|
|
Total interest-bearing deposits
|
|
$
|
885,351
|
|
|
$
|
3,480
|
|
|
|
0.79
|
%
|
|
$
|
1,016,320
|
|
|
$
|
4,940
|
|
|
|
0.98
|
%
|
|
Federal funds and repos purchased
|
|
|
1
|
|
|
|
—
|
|
|
|
—
|
|
|
|
—
|
|
|
|
—
|
|
|
|
—
|
|
|
Subordinated debt
|
|
|
58,079
|
|
|
|
1,280
|
|
|
|
4.44
|
%
|
|
|
27,346
|
|
|
|
805
|
|
|
|
5.94
|
%
|
|
FHLB borrowings
|
|
|
36,215
|
|
|
|
83
|
|
|
|
0.46
|
%
|
|
|
—
|
|
|
|
—
|
|
|
|
—
|
|
|
Total interest-bearing liabilities
|
|
$
|
979,646
|
|
|
$
|
4,843
|
|
|
|
1.00
|
%
|
|
$
|
1,043,666
|
|
|
$
|
5,745
|
|
|
|
1.11
|
%
|
|
Demand deposits and other
liabilities
|
|
|
517,281
|
|
|
|
|
|
|
|
|
|
|
|
474,566
|
|
|
|
|
|
|
|
|
|
|
Total liabilities
|
|
$
|
1,496,927
|
|
|
|
|
|
|
|
|
|
|
$
|
1,518,232
|
|
|
|
|
|
|
|
|
|
|
Stockholders' Equity
|
|
|
189,304
|
|
|
|
|
|
|
|
|
|
|
|
173,185
|
|
|
|
|
|
|
|
|
|
|
Total Liabilities and Stockholders'
Equity
|
|
$
|
1,686,231
|
|
|
|
|
|
|
|
|
|
|
$
|
1,691,417
|
|
|
|
|
|
|
|
|
|
|
Interest Rate Spread
|
|
|
|
|
|
|
|
|
|
|
3.55
|
%
|
|
|
|
|
|
|
|
|
|
|
2.91
|
%
|
|
Net Interest Income
|
|
|
|
|
|
$
|
31,460
|
|
|
|
|
|
|
|
|
|
|
$
|
26,608
|
|
|
|
|
|
|
Net Interest Margin
|
|
|
|
|
|
|
|
|
|
|
3.94
|
%
|
|
|
|
|
|
|
|
|
|
|
3.31
|
%
|
|
|
|
(1)
|
Includes loans classified as non-accrual
|
|
(2)
|
Includes average PPP balances of $25.2 million, related interest income of approximately $126,000, and $1.7 million in PPP fees recognized for the six months ended June 30, 2022. Includes average PPP balances of $158.0 million, related interest income of approximately $790,000, and $2.8 million in PPP fees recognized for the three months ended June 30, 2021
|
|
(3)
|
Total loan interest income includes amortization of deferred loan fees, net of deferred loan costs
|
|
(4)
|
Income and yields for all periods presented are reported on a tax-equivalent basis using the federal statutory rate of 21%
|
|
(5)
|
Refer to Appendix for reconciliation of non-GAAP measures
|
|
UNAUDITED SUMMARY FINANCIAL DATA
|
|
(Dollars in thousands except per share data)
|
|
|
|
At or For the Three
Months Ended
|
|
|
At or For the Six Months
Ended
|
|
|
|
June 30,
|
|
|
June 30,
|
|
|
|
2022
|
|
|
2021
|
|
|
2022
|
|
|
2021
|
|
|
Per share Data and Shares Outstanding
|
|
|
|
|
|
|
|
|
|
|
|
|
|
|
|
|
|
Earnings per common share (basic and diluted)
|
|
$
|
0.71
|
|
|
$
|
0.87
|
|
|
$
|
1.35
|
|
|
$
|
1.53
|
|
|
Book value per common share
|
|
$
|
21.41
|
|
|
$
|
20.18
|
|
|
$
|
21.41
|
|
|
$
|
20.18
|
|
|
Tangible book value per common share
(2)
|
|
$
|
20.75
|
|
|
$
|
20.18
|
|
|
$
|
20.75
|
|
|
$
|
20.18
|
|
|
Weighted average common shares (basic and diluted)
|
|
|
7,575,484
|
|
|
|
7,546,452
|
|
|
|
7,611,303
|
|
|
|
7,535,061
|
|
|
Common shares outstanding at end of period
|
|
|
7,526,463
|
|
|
|
7,549,398
|
|
|
|
7,526,463
|
|
|
|
7,549,398
|
|
|
Performance Ratios
|
|
|
|
|
|
|
|
|
|
|
|
|
|
|
|
|
|
Return on average assets (annualized)
|
|
|
1.39
|
%
|
|
|
1.67
|
%
|
|
|
1.36
|
%
|
|
|
1.50
|
%
|
|
Return on average equity (annualized)
|
|
|
12.59
|
%
|
|
|
16.28
|
%
|
|
|
12.09
|
%
|
|
|
14.64
|
%
|
|
Return on average common equity (annualized)
|
|
|
13.38
|
%
|
|
|
17.81
|
%
|
|
|
12.79
|
%
|
|
|
15.89
|
%
|
|
Yield on earning assets (FTE) (2) (annualized)
|
|
|
4.60
|
%
|
|
|
3.90
|
%
|
|
|
4.55
|
%
|
|
|
4.02
|
%
|
|
Cost of interest bearing liabilities (annualized)
|
|
|
1.08
|
%
|
|
|
1.11
|
%
|
|
|
1.00
|
%
|
|
|
1.11
|
%
|
|
Net interest spread (FTE)
(2)
|
|
|
3.52
|
%
|
|
|
2.84
|
%
|
|
|
3.55
|
%
|
|
|
2.91
|
%
|
|
Net interest margin (FTE)(2) (annualized)
|
|
|
3.95
|
%
|
|
|
3.20
|
%
|
|
|
3.94
|
%
|
|
|
3.31
|
%
|
|
Noninterest income as a percentage of average assets
(annualized)
|
|
|
0.30
|
%
|
|
|
0.37
|
%
|
|
|
0.29
|
%
|
|
|
0.36
|
%
|
|
Noninterest expense to average assets (annualized)
|
|
|
2.23
|
%
|
|
|
1.85
|
%
|
|
|
2.21
|
%
|
|
|
1.87
|
%
|
|
Efficiency ratio
(3)
|
|
|
54.61
|
%
|
|
|
54.12
|
%
|
|
|
54.70
|
%
|
|
|
53.22
|
%
|
|
Asset Quality
|
|
|
|
|
|
|
|
|
|
|
|
|
|
|
|
|
|
Commercial real estate loans to total capital
(4)
|
|
|
366.10
|
%
|
|
|
346.23
|
%
|
|
|
366.10
|
%
|
|
|
346.23
|
%
|
|
Construction loans to total capital
(5)
|
|
|
138.16
|
%
|
|
|
154.63
|
%
|
|
|
138.16
|
%
|
|
|
154.63
|
%
|
|
Loans 30-89 days past due to total gross loans
|
|
|
0.01
|
%
|
|
|
0.07
|
%
|
|
|
0.01
|
%
|
|
|
0.07
|
%
|
|
Loans 90 days past due to total gross loans
|
|
|
0.00
|
%
|
|
|
0.00
|
%
|
|
|
0.00
|
%
|
|
|
0.00
|
%
|
|
Non-accrual loans to total gross loans
|
|
|
0.00
|
%
|
|
|
0.00
|
%
|
|
|
0.00
|
%
|
|
|
0.00
|
%
|
|
Other real estate owned
|
|
$
|
—
|
|
|
$
|
1,158
|
|
|
$
|
—
|
|
|
$
|
1,158
|
|
|
Non-performing assets
|
|
$
|
—
|
|
|
$
|
1,158
|
|
|
$
|
—
|
|
|
$
|
1,158
|
|
|
Non-performing assets to total assets
|
|
|
0.00
|
%
|
|
|
0.07
|
%
|
|
|
0.00
|
%
|
|
|
0.07
|
%
|
|
Allowance for loan losses to total gross loans
|
|
|
0.91
|
%
|
|
|
0.87
|
%
|
|
|
0.91
|
%
|
|
|
0.87
|
%
|
|
Allowance for loan losses to non-performing assets
|
|
|
N/A
|
|
|
|
9.61
|
|
|
|
N/A
|
|
|
|
9.61
|
|
|
Net loan charge-offs (recoveries)
|
|
$
|
(2)
|
|
|
$
|
2
|
|
|
$
|
(5)
|
|
|
$
|
(16)
|
|
|
Net charge-offs (recoveries) to average gross loans (annualized)
|
|
|
N/A
|
|
|
|
N/A
|
|
|
|
N/A
|
|
|
|
N/A
|
|
|
Regulatory Capital Ratios (Bank only)
(1)
|
|
|
|
|
|
|
|
|
|
|
|
|
|
|
|
|
|
Total risk-based capital ratio
|
|
|
16.23
|
%
|
|
|
16.25
|
%
|
|
|
16.23
|
%
|
|
|
16.25
|
%
|
|
Tier 1 risk-based capital ratio
|
|
|
15.42
|
%
|
|
|
15.40
|
%
|
|
|
15.42
|
%
|
|
|
15.40
|
%
|
|
Leverage ratio
|
|
|
14.34
|
%
|
|
|
11.78
|
%
|
|
|
14.34
|
%
|
|
|
11.78
|
%
|
|
Common equity tier 1 ratio
|
|
|
15.42
|
%
|
|
|
15.40
|
%
|
|
|
15.42
|
%
|
|
|
15.40
|
%
|
|
Other information
|
|
|
|
|
|
|
|
|
|
|
|
|
|
|
|
|
|
Closing stock price
|
|
$
|
22.77
|
|
|
$
|
22.58
|
|
|
$
|
22.77
|
|
|
$
|
22.58
|
|
|
Equity / assets
|
|
|
10.61
|
%
|
|
|
10.52
|
%
|
|
|
10.61
|
%
|
|
|
10.52
|
%
|
|
Average equity / average assets
|
|
|
11.05
|
%
|
|
|
10.28
|
%
|
|
|
11.23
|
%
|
|
|
10.24
|
%
|
|
Number of full time equivalent employees
|
|
|
146
|
|
|
|
129
|
|
|
|
146
|
|
|
|
129
|
|
|
# Full service branch offices
|
|
|
6
|
|
|
|
7
|
|
|
|
6
|
|
|
|
7
|
|
|
|
|
(1)
|
Regulatory capital ratios as of June 30, 2022 are preliminary
|
|
(2)
|
Refer to Appendix for reconciliation of non-GAAP measures
|
|
(3)
|
Efficiency ratio is calculated as non-interest expense as a percentage of net interest income and non-interest income
|
|
(4)
|
Commercial real estate includes only non-owner occupied and construction loans as a percentage of Bank capital
|
|
(5)
|
Construction loans as a percentage of Bank capital
|
|
Unaudited Reconciliation of Certain Non-GAAP Financial Measures
|
|
(Dollars In thousands)
|
|
|
|
For the three months ended
June 30,
|
|
|
For the six months ended
June 30,
|
|
|
|
2022
|
|
|
2021
|
|
|
2022
|
|
|
2021
|
|
|
Net interest margin (FTE)
|
|
|
|
|
|
|
|
|
|
|
|
|
|
|
|
|
|
Net interest income (GAAP)
|
|
$
|
16,121
|
|
|
$
|
12,991
|
|
|
$
|
31,318
|
|
|
$
|
26,466
|
|
|
FTE adjustment on tax-exempt securities
|
|
|
70
|
|
|
|
70
|
|
|
|
142
|
|
|
|
142
|
|
|
Net interest income (FTE) (non-GAAP)
|
|
|
16,191
|
|
|
|
13,061
|
|
|
|
31,460
|
|
|
|
26,608
|
|
|
|
|
|
|
|
|
|
|
|
|
|
|
|
|
|
|
|
Average interest earning assets
|
|
|
1,644,863
|
|
|
|
1,638,799
|
|
|
|
1,609,844
|
|
|
|
1,621,080
|
|
|
Net interest margin (GAAP)
|
|
|
3.93
|
%
|
|
|
3.18
|
%
|
|
|
3.92
|
%
|
|
|
3.29
|
%
|
|
Net interest margin (FTE) (non-GAAP)
|
|
|
3.95
|
%
|
|
|
3.20
|
%
|
|
|
3.94
|
%
|
|
|
3.31
|
%
|
|
|
|
|
|
For the three months ended
June 30,
|
|
|
For the six months ended
June 30,
|
|
|
|
2022
|
|
|
2021
|
|
|
2022
|
|
|
2021
|
|
|
Stockholders equity, adjusted
|
|
|
|
|
|
|
|
|
|
|
|
|
|
|
|
|
|
Total stockholders equity (GAAP)
|
|
$
|
188,404
|
|
|
$
|
179,628
|
|
|
$
|
188,404
|
|
|
$
|
179,628
|
|
|
Less: preferred stock
|
|
|
(27,263)
|
|
|
|
(27,263)
|
|
|
|
(27,263)
|
|
|
|
(27,263)
|
|
|
Total common stockholders equity (GAAP)
|
|
|
161,141
|
|
|
|
152,365
|
|
|
$
|
161,141
|
|
|
$
|
152,365
|
|
|
Less: intangible assets
|
|
|
4,956
|
|
|
|
—
|
|
|
|
4,956
|
|
|
|
—
|
|
|
Tangible common stockholders equity (non-GAAP)
|
|
|
156,185
|
|
|
|
152,365
|
|
|
|
156,185
|
|
|
|
152,365
|
|
|
|
|
|
|
|
|
|
|
|
|
|
|
|
|
|
|
|
Shares outstanding
|
|
|
7,526,463
|
|
|
|
7,549,398
|
|
|
|
7,526,463
|
|
|
|
7,549,398
|
|
|
Tangible book value per common share (non-GAAP)
|
|
$
|
20.75
|
|
|
$
|
20.18
|
|
|
$
|
20.75
|
|
|
$
|
20.18
|
|
")
")
 View original content to download multimedia:https://www.prnewswire.com/news-releases/mainstreet-bancshares-inc-reports-strong-net-income-as-interest-rates-rise-301592026.html
SOURCE MainStreet Bancshares, Inc.